


Netdata, VMware Aria Operations, and Veeam ONE lead the best VMware monitoring tools for 2026-27, though the right pick depends on data granularity, vSphere coverage depth, and pricing structure. Ten tools made the shortlist, and they were compared across three dimensions, with two criteria (vSphere API depth and deployment simplicity) separating the field fastest.
- The Best VMware Monitoring Tools for 2026-27
- How We Evaluated VMware Monitoring Tools
- Scoring Criteria
- 1. Netdata
- Best For
- Pricing
- Pros
- Where Teams Pair It
- Verdict
- Best Open-Source VMware Monitoring With Per-Second Granularity
- 2. VMware Aria Operations (Formerly vRealize Operations)
- 3. Veeam ONE
- 4. SolarWinds Virtualization Manager (VMAN)
- 5. Paessler PRTG Network Monitor
- 6. Datadog Infrastructure Monitoring
- 7. ManageEngine OpManager
- 8. Zabbix
- 9. LogicMonitor
- 10. Checkmk
- 11. NAKIVO Backup & Replication
- How to Choose the Right VMware Monitoring Tool
- Frequently Asked Questions
- What Is the Best Free VMware Monitoring Tool?
- How Does Netdata Monitor VMware vSphere?
- What Is the Difference Between VMware Aria Operations and Veeam ONE?
- Can Zabbix Monitor VMware vSphere?
- How Much Does VMware Monitoring Cost?
- What VMware Metrics Should I Monitor?
- Is PRTG Good for VMware Monitoring?
- Can Netdata Replace VMware Aria Operations?
- How Does Datadog Bill for VMware vSphere Monitoring?
Virtualized performance problems rarely announce themselves. A general-purpose monitoring tool watching generic servers sees generic host counters, so it misses CPU ready on contended hosts, co-stop on wide VMs, memory ballooning that tips into guest swapping, and datastore latency cliffs. Snapshot accumulation and long snapshot chains do their damage more slowly but just as reliably. These are vSphere-specific metrics. They only surface when vCenter, ESXi hosts, clusters, resource pools, datastores, and VMs are all reachable through a full object model with auto-discovery.
Granularity is the second trap. VMware’s real-time statistics ceiling is 20 seconds, while 5-minute historical data is what many tools settle for. A spike that lasts under a minute, or 30 seconds of VM stalls, can vanish inside one polling interval. Per-second guest-OS visibility and application visibility fill that gap, and real-time visibility pays for itself quickly: 41% of enterprises put a single hour of unplanned downtime at $1 million or more.
Cost is the third trap. After the 2023 acquisition of VMware, Broadcom moved toward subscription pricing that is bundle-dependent and tier-dependent, and some enterprise customers report increases of 300-1,500%. Monitoring has its own pricing shape: per-host, per-socket licensing, per-sensor, per-device, per-service, or quote-based. List prices say little, because the bill grows with VM sprawl in dynamic environments.
Deployment decides what actually gets adopted. Teams running Linux or Windows want time-to-value measured in an afternoon, and they want to skip manually registering every host across the fleet. Alerting quality and VMware-native integration matter to enterprise IT as much as any enterprise suite’s feature list. Within six months of deployment, most teams know whether the monitoring stack fits. The commercial tools below range from heavyweight to light, and Netdata sits at the open end of infrastructure monitoring.
The Best VMware Monitoring Tools for 2026-27
Eleven tools are covered here: Netdata, Aria Operations, Veeam ONE, SolarWinds VMAN, PRTG, Datadog, OpManager, Zabbix, LogicMonitor, Checkmk, and NAKIVO. Each earns its place for a different buyer, and the sections below are ordered by how they scored, not by brand size.
How We Evaluated VMware Monitoring Tools
The evaluation relied on vendor documentation, published comparisons, and practitioner threads rather than lab benchmarks. VMware monitoring software stayed on the shortlist only with genuine vSphere integration, so tools that merely ping VMs over ICMP were excluded. Each remaining tool got a score on coverage depth, data granularity, guest OS metrics, pricing predictability, and deployment friction. The most common complaints from VMware admins, surprise bills and month-long rollouts, shaped the weights.
Scoring Criteria
Each tool was scored out of 100 across six weighted criteria, and the weights reflect what admins complain about most.
| Criterion | Weight | What Counts |
| vSphere Coverage Depth | 25% | Full object model: hosts, clusters, resource pools, datastores, VMs, vSAN, vSphere API |
| Data Granularity | 20% | Collection interval, per-second guest visibility, the 20-second VMware real-time ceiling |
| Ease of Deployment | 20% | Install effort, discovery, credential setup, multi-vCenter handling, time-to-value |
| Alerting and Anomaly Detection | 15% | Prebuilt alerts, ML anomaly detection, noise reduction, vSphere alert quality |
| Scalability and Architecture | 10% | Distributed collection, large fleets, nodes, architectural changes at scale |
| Pricing Predictability | 10% | How sockets, units, services, and sensors translate into the bill |
Dashboards and real-time visibility were checked on every tool but not weighted separately.
1. Netdata
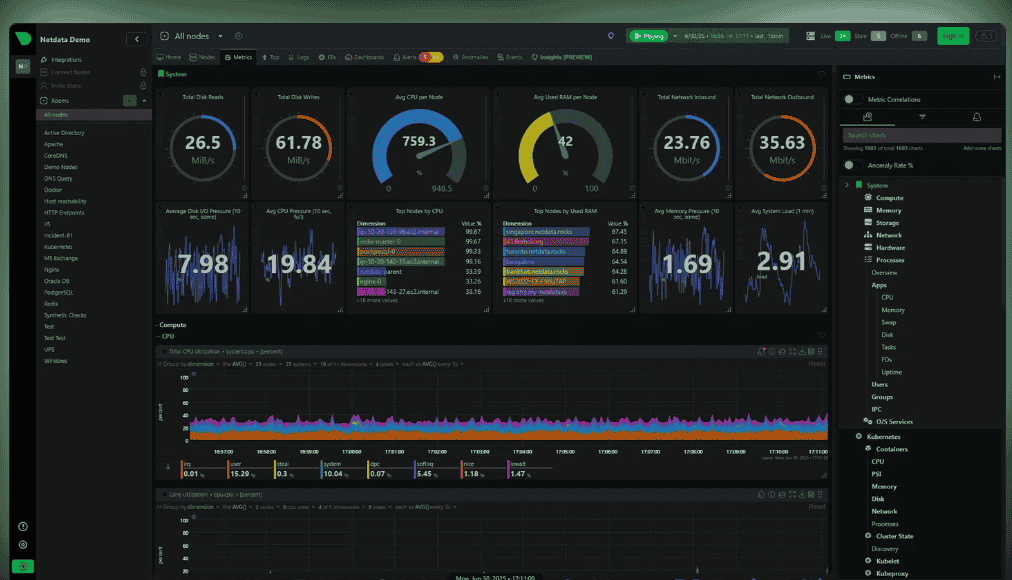
Netdata is an open-source infrastructure monitoring platform whose built-in vSphere API collector reads vCenter for ESXi hosts, clusters, VMs, resource pools, and datastores, then layers ML anomaly detection on top with per-second, real-time collection inside guests.
Best For
Netdata suits VMware admins who want guest OS visibility and application visibility inside VMs, collected per-second, without paying more as metrics volume grows. AI-assisted troubleshooting and ML anomaly detection sit on top of the vSphere API data. Predictable per-node pricing means no socket, sensor, or metric-based charges.
Pricing
Netdata Cloud Business costs $4.50/node/month on annual plans, and the per-node rate does not move with users or metrics volume. According to Netdata’s published pricing, node count is the main lever, and containers are not billed separately.
- Free Community plan: 5 active connected nodes, aimed at personal and non-commercial use.
- Open-source Agent: GPLv3+.
- Homelab plan: a hobbyist tier.
- Enterprise on-prem and 200+ node licenses: negotiated directly.
- Logs Monitoring: adds querying logs in place, and data retention varies by plan.
Pros
- Auto-discovery: zero-config auto-discovery across 800+ integrations. The vSphere collector then maps hosts, datastores, resource pools, and clusters through the vSphere API once credentials are supplied.
- Utilization data: ESXi host utilization and VM CPU/memory arrive at 20-second intervals, which matches the VMware real-time statistics ceiling.
- Guest depth: per-second collection on guest OS and application metrics, which vSphere itself cannot provide.
- Snapshot hygiene: snapshot age and snapshot chain depth are visible, so forgotten snapshots surface early.
- Hardware coverage: the SNMP collector with the vmware-esx profile covers ESXi hardware, HBA, and environment sensors. vSAN monitoring is optional.
- Alerting: unsupervised ML anomaly detection plus prebuilt alerts.
- Cost of entry: GPLv3+ licensing and a free Community plan of 5 active connected nodes.
- Vendor claims: Netdata cites an 80% MTTR reduction and a 90% cost reduction. These are vendor figures, so treat them as directional.
Where Teams Pair It
The go.d.plugin vsphere module needs a vCenter URL and a read-only account. It pulls real-time statistics for hosts and VMs and 5-minute historical intervals for datastore and cluster performance metrics, depending on entity types. Collection will resume after a vCenter reboot, and other Netdata collectors auto-detect, though vSphere does not. Teams under PCI, HIPAA, or FISMA often pair it with Aria Operations, since compliance packs, prebuilt compliance dashboards, and independent assessments are not Netdata’s territory.
Verdict
Netdata offers the finest data granularity here and the best troubleshooting power per dollar. Node count, not metrics volume, drives a predictable pricing shape. The trade-offs are manual vCenter credentials, less vSphere inventory depth than Aria Operations or Veeam ONE, and no compliance packs. Per-second guest and application data, ML anomaly detection, and auto-discovery make it a strong choice for VMware shops.
Best Open-Source VMware Monitoring With Per-Second Granularity
Netdata gives per-second granularity under a GPLv3 open-source license, with per-node pricing that keeps predictable costs as VM counts climb. Tools polling every 60 seconds, or even 30 seconds, average away performance spikes. At per-second granularity, memory balloon driver activity, CPU ready times, disk I/O latency, network interface errors, and network throughput per VM all stay visible. ESXi host and datastore data come from the vSphere API on its own cadence.
The ML layer ranks the 30-50 most relevant anomalies by severity, turning undifferentiated alerts into root cause candidates. Broadcom pricing changes make granularity versus cost a live trade-off, and per-metric tools or commercial tools with metric or user caps hit a cost ceiling. Netdata auto-discovers instead of demanding manual registration, supports cloud streaming, and offers open-source flexibility without a premium commercial license.
2. VMware Aria Operations (Formerly vRealize Operations)
VMware Aria Operations, formerly vRealize Operations, is VMware’s own operations platform for capacity planning, predictive analytics, and compliance packs, and it arrives bundled in VMware Cloud Foundation and vSphere Foundation.
Best For
Enterprises and VMware-centric shops already holding a VMware Cloud Foundation or vSphere Foundation license get the most from it. That is especially true where capacity forecasting, predictive analytics, and HIPAA, PCI, or FISMA compliance packs drive the purchase. It reaches into vCenter, vSAN, and NSX from one place.
Pricing
Aria is priced per-core and tied to a bundle tier. Under Broadcom bundles, core count and the VMware Cloud Foundation or vSphere Foundation tier decide what is licensed. Teams should confirm whether Aria editions are sold standalone in their quote.
Pros
- Native inventory: native vSphere inventory straight from vCenter, plus vSAN and NSX, without third-party tools.
- Planning: capacity planning, forecasting, and predictive analytics built on historical usage patterns.
- Cost control: FinOps-style cost views and rightsizing recommendations.
- Compliance: native compliance packs for PCI, HIPAA, and FISMA.
- Workflow fit: a vSphere Web Client plugin keeps it close to daily admin work.
Cons
- Setup: complex deployment. Practitioners describe weeks of setup and heavy configuration.
- Pricing: per-core bundle pricing exposes buyers to Broadcom portfolio changes, and the VCF or vSphere Foundation bundle is the main route in. Licensed independently of the full VMware stack, it is hard to justify for smaller fleets.
- Granularity: 5-minute historical intervals apply to many entity types, and the 20-second VMware real-time ceiling applies to the rest.
Verdict
Aria is the strongest vSphere-native monitoring option on inventory depth, compliance coverage, and capacity planning. The licensing barrier and heavyweight deployment are real drawbacks. Teams already inside the VMware ecosystem with VMware Cloud Foundation or vSphere Foundation bundles get it effectively included. The 20-second collection ceiling means per-second alternatives are still needed for spike hunting.
Best Native vSphere Integration
Aria Operations offers the best native vSphere integration because it understands vSphere internals: DRS recommendations, cluster policies, and storage DRS visibility, which standard APIs expose only partly to third-party tools. Configuration metadata, capacity utilization, cluster health, and VM performance land in a unified view and a single interface, with native capacity modeling on top. The catch is cost exposure. Post-acquisition, it travels inside subscription bundles, the Broadcom enterprise bundle among them, so standalone cost is hard to isolate and the VMware/Broadcom ecosystem lock deepens. Native integration is the draw, and the bundle is the price.
3. Veeam ONE

Veeam ONE is a monitoring and reporting product from the Veeam ecosystem that covers VMware vSphere, capacity planning, and Veeam backup environments. A free Community Edition suits small deployments.
Best For
VMware admins in small shops who want one tool for vSphere and Veeam Backup and Replication are the natural fit. They also get management reporting, business documentation, and backup reporting. The free Community Edition removes the entry barrier.
Pricing
Licensing is per-instance, and in practice per-socket: workload instances for managed VMware vSphere and Hyper-V hosts are priced by CPU sockets. The free Community Edition covers small deployments.
Pros
- Deep vSphere monitoring: VM performance data and health dashboards.
- Business grouping: VMware tags let reports slice by business unit, department, or geography.
- Backup in view: custom infrastructure reports and Veeam Backup and Replication health in the same place.
- Management reporting: the free Community Edition suits small environments.
Cons
- Narrow scope: practitioners note it is not a general-purpose infrastructure monitoring platform. It reads vCenter metrics well but is a weak standalone monitor outside virtual environments and backup environments.
- Licensing: per-instance licensing and per-socket costs scale with the fleet, and Aria Operations is the natural comparison for deeper native analytics.
Verdict
Veeam ONE wins for the VMware shop already running Veeam backup, where socket-based licensing, backup health, and business-grouping features justify it. One console and management-facing documentation make reporting easy, though VM performance depth is its draw and general-purpose platforms cover more. Its narrow scope within the Veeam ecosystem is both the strength and the limit.
Best Monitoring Add-On for Teams Already Using Veeam Backup
Veeam ONE is the best add-on for teams already using Veeam Backup and Replication, because backup job monitoring, protection status, and VM performance sit in a single console. Pre-built report templates and resource utilization reports support availability decisions and compliance teams without custom query writing. Nutanix AHV and Hyper-V are covered too, and real-time alerting and capacity planning for VMware vSphere come along. The gap is VMware-specific telemetry depth, so purpose-built tools beat it as a standalone monitoring tool. Its value is unified production and protection visibility, and Veeam Backup licensing makes it a small step up.
4. SolarWinds Virtualization Manager (VMAN)

SolarWinds Virtualization Manager is a self-hosted virtualization monitoring product covering VMware vSphere, Microsoft Hyper-V, and Nutanix AHV, centered on capacity planning, scenario modeling, and VM sprawl control.
Best For
VMAN fits VMware admins in mixed environments already running SolarWinds Orion, as a module for dedicated capacity planning and trend prediction. Scenario modeling is the headline feature, and it works across Hyper-V and Nutanix AHV too.
Pricing
Pricing is quote-based with no public price list. Licensing follows CPU sockets: per-socket licensing on each monitored host, so socket count drives the cost and all VMs are included.
Pros
- Sprawl and chargeback: VM sprawl control and chargeback automation.
- Planning: capacity planning with historical and trending data, scenario modeling for storage needs, and configuration management.
- Coverage: VMware vSphere, Microsoft Hyper-V, and Nutanix AHV, with CPU and memory trends.
- Cost model: a per-socket model per licensed host, where VM count does not raise the price.
Cons
- Delivery: no SaaS option, because it is on-premises only.
- Structure: it is a core module that needs additional paid functionality to reach full value, which can fragment the toolset.
- Pricing: quote-based pricing complicates budgeting. Heading into 2026, SolarWinds price increases are a recurring customer concern.
Verdict
VMAN suits dense VMs on a per-host basis, because the per-socket model flattens cost as VM counts rise. It is a dedicated virtualization manager for sprawl control, scenario modeling, and capacity planning. It is on-prem only, and the SolarWinds cost trajectory deserves scrutiny. It also lacks the fine granularity needed for real-time troubleshooting, and it is not per-sensor pricing either.
Best for VM Rightsizing and Capacity Planning
VMAN is the best fit for VM rightsizing and capacity planning in large vSphere clusters, because it produces structured rightsizing recommendations from CPU, memory, storage, and network data. It flags over-provisioned and under-provisioned VMs and idle machines, shows projected cost savings, and ties them to rightsizing actions. Pairing with NPM adds network performance, and SAM adds application dependency mapping. Real-time monitoring is not the focus, and cloud-native tools or automation tools beat it on setup time. Integration pathways inside the SolarWinds ecosystem make it a good fit for on-premises IT operations fighting VM sprawl.
5. Paessler PRTG Network Monitor
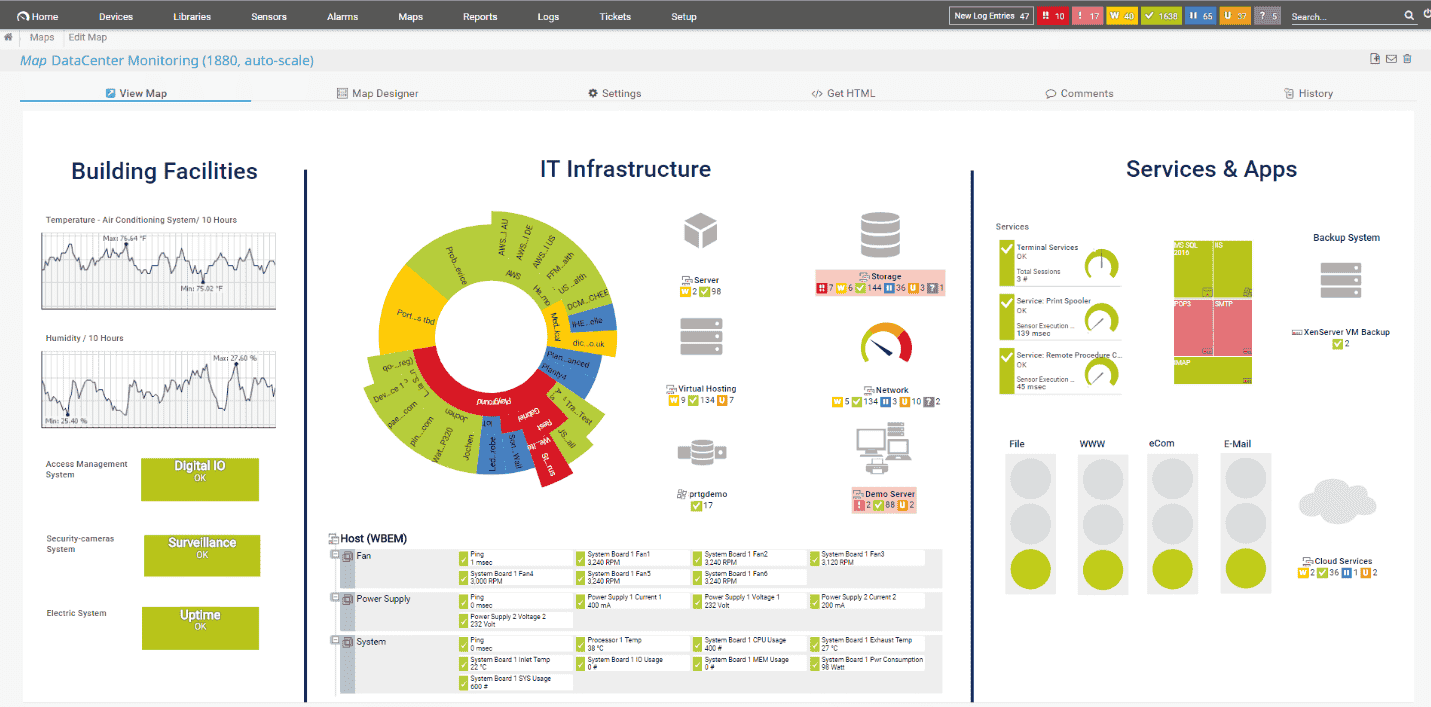
PRTG is an all-in-one infrastructure monitoring and network monitoring tool that reaches vCenter, ESXi hosts, VMs, and datastores through VMware SOAP sensors.
Best For
PRTG suits mid-size teams that want per-sensor granularity and a freeware edition for small VMware environments. Auto-discovery of server, network, and virtualization monitoring lives in one tool.
Pricing
PRTG charges one sensor per monitored aspect, with a freeware edition for very small environments and sensor-based subscription tiers above it. VM sprawl and sensor count drive the bill, because every VM and datastore can consume sensors.
Pros
- VMware sensors: Virtual Machine, Datastore, Host Performance, Host Hardware, and Host Hardware Status.
- Protocols: SOAP and API access, with WBEM for hardware, in vCenter environments.
- Breadth: network devices sit beside the hypervisor, and auto-discovery builds the sensor list.
- Entry cost: a freeware edition.
Cons
- Platform: Windows-only server deployment.
- Sensor math: sensor-based licensing is expensive at scale. With one sensor per VM, 50 VMs and 10 hosts is a modest mid-size cluster, yet core metrics, datastores, and network devices can push counts past over a thousand sensors.
- Sprawl: VM sprawl inflates sensor counts quickly.
Verdict
PRTG is a manageable choice for small VMware environments with a few hundred sensors. It becomes a poor fit at scale, because dense fleets multiply sensors faster than licensing planning expects. A manageable sensor count is the whole story, and sprawl breaks it.
Best Sensor-Based Monitoring for Multi-Hypervisor Environments
PRTG is the best sensor-based monitoring tool for multi-hypervisor teams. A single console covers VMware vSphere and Hyper-V hypervisors with broad platform coverage, tracking VM health, uptime, CPU usage, and memory utilization. Core metrics from mixed environments flow in through auto-discovery. The sensor-based approach demands license planning: tiers such as 500, 1,000, and 2,500 sensors set sensor budgets, and 1,000+ sensors arrive sooner than expected (50 VMs and 10 hosts is only the start). Dedicated monitoring engineers keep the sensor count and UI tidy.
6. Datadog Infrastructure Monitoring
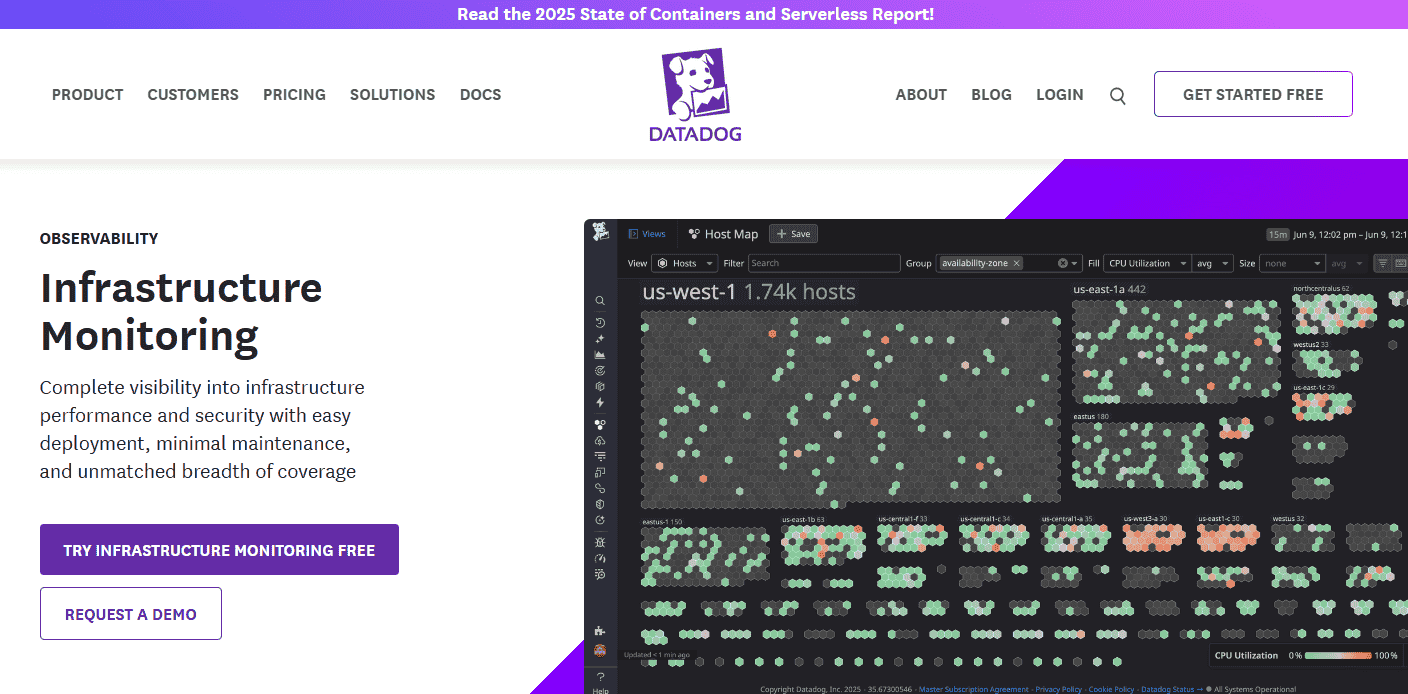
Datadog is a SaaS observability platform whose Datadog Agent and vSphere integration collect infrastructure telemetry and application telemetry from VMs and ESXi hosts.
Best For
Datadog suits teams that want a pane of glass, with mature alerting, cloud monitoring, and an integration catalog alongside vSphere data. It is strongest for application monitoring on applications running on VMs, delivered as SaaS.
Pricing
Datadog’s per-host pricing has layers. Infrastructure Monitoring uses per-host allotments, while custom metrics bring per-metric overages and logs bring per-GB charges. Retention choices and ingested volume shape the invoice, and host count sets the base.
Pros
- Depth: guest OS metrics and deeper VM visibility through agent-based collection with the Datadog Agent.
- Correlation: APM, events, and services in a unified view, with real-time metrics.
- Maturity: hundreds of integrations, mature dashboards, and strong alerting.
- Hosts: ESXi hosts covered alongside guests.
Cons
- Setup: it needs a read-only service account and a vCenter server connection, plus the Datadog Agent for guest depth.
- Billing: every billable host adds to layered pricing, and bill complexity from custom metrics and logs is a recurring complaint. Price increases compound the issue, and VM sprawl raises host counts.
Verdict
Datadog is a workflow advantage for existing customers who want application traces next to hypervisor metrics. The per-host billing model can punish VM-dense environments, so invoice and host math should be done first. For a VMware-only purchase, the vSphere integration and logs rarely justify it alone.
Best for Hybrid Environments Combining VMware With Cloud Workloads
Datadog is the best choice for hybrid infrastructure teams combining VMware with cloud workloads on AWS, Azure, or GCP. Full-stack observability and cross-stack correlation connect VMware-layer metrics, the hypervisor layer, and guest VMs to application performance data and APM. Without it, manual correlation between on-premises inventory and cloud services is slow. AI-driven alerting cuts noise, and the dashboard ecosystem helps large VMware deployments. Cloud correlation matters most for teams with vCenter and ESXi hosts spanning data centers and clouds. Per-host pricing still applies, so a 100-host vSphere environment needs careful costing.
7. ManageEngine OpManager

ManageEngine OpManager is a network monitoring and infrastructure monitoring product with native VMware support: vCenter discovery, auto VM discovery for ESXi, and a VM sprawl dashboard.
Best For
OpManager suits IT teams and VMware admins who want unlimited sensors per device and device-based licensing for network and server monitoring, plus a VM sprawl dashboard and auto VM discovery out of the box.
Pricing
OpManager uses device-based licensing: per monitored device, with unlimited interfaces, disk volumes, and sensors per device. Buyers choose a perpetual license or an annual subscription, and VMs are counted as devices.
Pros
- Deployment: on-premises and cloud editions.
- VMware coverage: native VMware API monitoring, with auto VM discovery and vCenter environment changes tracked.
- Visibility: a dedicated VM sprawl dashboard.
- Pricing: device-based licensing with unlimited sensors per device avoids per-metric surprises.
Cons
- Interface: dated UI that some find clunky.
- Fit: deep specialization is limited, as it is a broader network monitoring tool compared with modern observability platforms.
- Pricing: device-based licensing climbs with VM count, and sprawl pushes it further.
- Ecosystem: it leans on the ManageEngine ecosystem.
Verdict
OpManager is the budget-conscious license choice against PRTG’s per-sensor approach. It is an adequate generalist: network-plus-virtualization monitoring with auto VM discovery and a clean vSphere integration. The unlimited-sensors-per-device model is the draw, and ManageEngine buyers should not expect a modern experience.
Best for Mid-Market Teams Needing Network and VM Monitoring Together
OpManager is the best option for mid-market IT teams that need network and VM monitoring together without enterprise-level licensing costs. It covers ESX/ESXi servers and physical network devices, along with virtual machine performance, CPU, memory, and disk. Alerting customization and dashboard UI are workable, while documentation is solid. As an affordable platform it avoids separate product licenses, and enterprise-focused competitors cost more, though cloud-native tools have moved faster over the last five years. The trade-off is the pricing tier and a UI that needs dedicated monitoring engineers to tune, but network infrastructure and VMs share one view.
8. Zabbix
Zabbix is an open-source monitoring platform with built-in VMware templates, low-level discovery, and custom VMware performance counters for vCenter and ESXi.
Best For
Zabbix fits VMware shops with Linux expertise that want to avoid vendor lock-in and per-sensor license fees. It offers unlimited hosts, with low-level discovery of datastores, clusters, and metrics for vCenter, ESXi hosts, and VMs on a per-host basis in an open-source platform.
Pricing
Zabbix is AGPLv3 with no license fee, and the real cost is engineering time. Technical support subscriptions come in a support tier, and Zabbix Cloud SaaS prices on cloud usage rather than on infrastructure size. Open source stays open source either way.
Pros
- Templates: out-of-the-box templates, including built-in VMware templates for ESXi hypervisors and a VMware hypervisor performance counter.
- Discovery: low-level discovery across vCenter, datastores, clusters, and hosts.
- Limits: no host or metric limits, and no license fee under AGPLv3.
- Maturity: a long operational track record and an active community.
Cons
- Operations: a steep learning curve and an upgrade burden, with database, HA, macros, and templates all needing care in self-hosted operation.
- Workflows: configuration workflows demand expertise.
- Cloud: Zabbix Cloud is an official SaaS but a separate paid service, and modern observability platforms feel smoother.
Verdict
Zabbix is the fully open-source option, and automatic discovery plus vSphere API integration make it a real contender. Staffing is the hidden cost: Linux and database skills, and engineering time, replace license fees. Default polling is slower than per-second tools, which matters on very large fleets, so the licensing conversation with finance should account for time, not only invoices.
9. LogicMonitor
LogicMonitor is a SaaS monitoring platform that handles VMware vSphere monitoring through the vSphere Web Services API, with out-of-the-box coverage for vCenter, ESXi hosts, VMs, and vSAN.
Best For
LogicMonitor suits teams that want vCenter-managed ESXi hosts onboarded through automated discovery, with ML-driven dynamic thresholds and an integration library. There is no infrastructure to manage, because it is a SaaS monitoring platform.
Pricing
LogicMonitor prices through tiered platform packages built on a hybrid unit, so the hybrid unit count depends on resource types. Add-ons such as AI, logs, and synthetics raise the package tier.
Pros
- vSphere support: vSphere 8 coverage through the vSphere Web Services API, with power state and vSAN monitoring.
- Discovery: automated recurring discovery, with naming and filters driven by vCenter tags.
- Reach: thousands of integrations plus Automation APIs.
- Alerting: ML-driven dynamic thresholds and official support.
Cons
- Packages: entry package caps and a tier jump when limits are hit.
- Cost and architecture: hybrid unit pricing and price increases are a recurring complaint among practitioners. SaaS-only deployment also means monitoring data leaves your network.
Verdict
LogicMonitor is a strong SaaS option for VM-dense environments that need vSphere API coverage, vSAN support, and automated discovery. Telemetry on-prem is not possible with a SaaS-only architecture. Unit math under the hybrid unit pricing model needs checking against your inventory before signing.
10. Checkmk
Checkmk is an open-core monitoring platform with agentless data collection through built-in vSphere API integration for VMware ESXi and vCenter. Its pricing is service-based.
Best For
Checkmk fits VMware admins who want agentless vSphere API monitoring without installing agents, plus a genuine free edition and monitoring depth. Per-host fees disappear under service-based pricing, and the open-core platform scales to the enterprise.
Pricing
Checkmk Raw is GPLv2 and open-source, with a free mode for small deployments. Commercial editions price by monitored services. A sensor-like unit, one individual monitored aspect such as CPU usage, a file system, or custom metrics, counts as a service.
Pros
- Collection: no agent installation, with vSphere API integration for VMware ESXi and ESXi hosts.
- Scale: distributed monitoring suits very large fleets.
- Licensing: GPLv2 Raw edition, with commercial editions above it.
- Depth: strong monitoring depth under service-based pricing.
Cons
- Learning: a steep learning curve, with rule configuration and recurring setup questions.
- Edition gaps: advanced reporting, distributed monitoring, and other enterprise features sit outside the Raw edition. Support relies on community forums.
- Pricing math: service counts grow quickly with vCenter and ESXi monitoring, and practitioners cite friction at that point.
Verdict
Checkmk gives agentless VMware monitoring with a strong open-source edition, but time-to-value depends on configuration complexity. On a busy VM estate the service counts get large, while a quiet one stays cheap. The pricing unit is the thing to model, because the Checkmk model rewards forecasting.
11. NAKIVO Backup & Replication
NAKIVO Backup & Replication is the best combination of VMware monitoring and data backup: one product covering replication, recovery, and infrastructure monitoring for VMware vSphere.
Best Combination of VMware Monitoring and Data Backup
NAKIVO Backup & Replication gives comprehensive data protection and infrastructure health in a unified console, with a single view of job status, backup job failures, and protection status beside VM health. Real-time visibility into CPU, memory, storage, and network metrics catches resource spikes and infrastructure capacity problems early. Performance thresholds trigger alerts, and recovery planning sits in the same backup interfaces. It is a cost-effective solution compared with enterprise-only alternatives, with no separate licensing for monitoring. Teams squeezed by Broadcom bundles get unified management of data backup and deployment simplicity in one product.
How to Choose the Right VMware Monitoring Tool
Match the pricing model and polling granularity to your fleet first, then check vSphere depth. Teams under 50 hosts can often start with a free or low setup friction tool, while larger enterprises need predictable pricing at enterprise scale.
- Polling granularity: a 30-second interval is the practical floor for most vSphere API tooling, and sub-minute events (a polling interval shorter than the spike itself) disappear without it.
- Billing model: per-host billing, per-metric billing, and socket pricing scale differently with VM count. Broadcom licensing changes and subscription price increases, such as the 300-1,500% reported after the Broadcom-VMware acquisition, make VMware cost exposure a monitoring question as well.
- Integration depth: deep VMware API integration beats a long feature list, and the alerting stack should plug into alert routing and ticketing systems. Validate it with automation testing tools before go-live.
- Staffing: small IT teams value low setup friction, while enterprise customers can absorb heavier monitoring infrastructure.
- Downtime math: a single hour of downtime costs $1 million or more for 41% of enterprises, so over a three-year horizon, monitoring data quality matters more than any vendor’s feature list. Multi-cluster vSphere environments reward distributed collection.
Frequently Asked Questions
What Is the Best Free VMware Monitoring Tool?
Netdata’s open-source Agent (GPLv3+) is the best free VMware monitoring tool for most teams, because its vSphere collector covers hosts, VMs, datastores, clusters, and resource pools. The free Community plan allows 5 active connected nodes for personal and non-commercial use.
Alternatives exist. Zabbix is AGPLv3 with no license fee, but engineering time is the real price. Veeam ONE Community Edition caps you at a limited number of instances. PRTG’s freeware edition limits you to a low sensor count. Self-hosted tools may be free forever in their distribution model, yet infrastructure and staff time still cost money.
How Does Netdata Monitor VMware vSphere?
Netdata monitors vSphere through the go.d.plugin vsphere module, a vSphere API collector that connects to vCenter with a read-only account. It gathers host and VM metrics at 20-second intervals, which is the real-time statistics ceiling, and datastore and cluster performance metrics at 5-minute historical intervals. Resource pools, hosts, VMs, datastores, and clusters are all entity types it maps.
For ESXi hardware, HBA, and environment sensors, the SNMP collector with the vmware-esx profile fills in, and vSAN is optional. Per-second collection happens inside the guest OS for application metrics, not in vSphere itself, so real-time stats from vCenter stay at the 20-second level.
What Is the Difference Between VMware Aria Operations and Veeam ONE?
Aria Operations is a native operations platform licensed per core inside VMware Cloud Foundation or vSphere Foundation, while Veeam ONE is licensed per socket or per instance and focuses on Veeam backup environments and reporting. Aria brings compliance packs, capacity planning, and predictive analytics. Veeam ONE reads vCenter metrics and ties them to Veeam Backup and Replication.
Practitioners often say that with a VMware license that includes Aria Operations, monitoring is a no-brainer. Veeam ONE wins where backup is the center of the shop.
Can Zabbix Monitor VMware vSphere?
Yes, Zabbix monitors vSphere through the VMware API (SOAP) with a read-only vCenter account. Built-in VMware templates and low-level discovery cover ESXi hypervisors, hosts, datastores, clusters, and VMs, and a VMware hypervisor performance counter item adds depth.
Open source means no license fee under AGPLv3, and paid options include support subscriptions and Zabbix Cloud.
How Much Does VMware Monitoring Cost?
VMware monitoring costs range from nothing to per-GB bills, depending on the pricing shape. Netdata Cloud Business is $4.50/node/month on annual plans, and its Agent and free Community plan (5 active connected nodes, non-commercial use) cost nothing. Open-source tools have no license fee but cost engineering time.
| Tool | Pricing Shape |
| Netdata | Per-node |
| Aria Operations | Bundled per-core |
| Veeam ONE | Per-socket or per-instance |
| SolarWinds VMAN | Per-socket, quote-based |
| PRTG | Per-sensor |
| Datadog | Per-host plus per-GB and custom metric charges |
| OpManager | Per-device |
| LogicMonitor | Hybrid units |
| Checkmk Raw | Free; service-based commercial editions |
| Zabbix | No license fee |
Watch socket count, ingestion volume, and VM sprawl, which push every one of these upward in different ways across infrastructure.
What VMware Metrics Should I Monitor?
Start with CPU ready, co-stop, and contention, because they show where VMs wait for CPU. Then add memory ballooning, guest swapping, and host swapping, which point to memory pressure.
- Storage problems: datastore latency, latency cliffs, and errors.
- Snapshots: snapshot accumulation, age, and chain depth.
- Network: throughput, packet loss, and network drops.
- Planning: utilization trends and capacity planning for ESXi hosts and VMs.
Is PRTG Good for VMware Monitoring?
PRTG is good for small VMware environments and poor at scale, because its sensor-based model uses VMware SOAP sensors: Host Performance, Host Hardware (WBEM), Host Hardware Status, Virtual Machine, and Datastore. One sensor per VM means 50 VMs and 10 hosts is manageable. A mid-size cluster with core metrics added can pass over a thousand sensors, and paid tiers become expensive at scale. The freeware edition suits a low sensor count, but watch sensor counts.
Can Netdata Replace VMware Aria Operations?
Netdata can replace Aria Operations for performance analysis, but not for regulated shops. Its vSphere collector and per-second guest visibility beat the 20-second real-time statistics ceiling, and optional vSAN plus infrastructure monitoring cover the technical core.
What it lacks is capacity planning depth, log management, and compliance packs for PCI, HIPAA, and FISMA, along with independent assessments. Aria Operations also arrives inside VMware Cloud Foundation and vSphere Foundation bundles, so the two often run together over the same resource pools, hosts, VMs, datastores, and clusters.
How Does Datadog Bill for VMware vSphere Monitoring?
Datadog bills per billable host under Infrastructure Monitoring, with per-host allotments for custom metrics. Per-custom-metric overages and per-GB log ingestion add to it. The vSphere integration uses a read-only service account against the vCenter server, and the Datadog Agent on each monitored VM or ESXi host can add billable hosts, so VM sprawl raises the per-host total.